Session 1: Steps (teaching notes)
Ask students to adopt the perspective of a reviewer and scrutinize methodological choices
Steps
Warm-up Ask students to draft the steps of a literature review (how they would approach it). Few students: whiteboard, More students: on paper and circulate it afterwards (reflect). Possible observations: iterations, generic vs. detailed steps, missing steps (such as reading, citation searches)
Discuss how the models fit together / what the underlying differences are
- Reading activities: in the “data extraction” hermeneutic vs. systematic traditions inductive/emergent vs. deductive form of data analysis
Okoli: screen before search? (search: “reporting the search”)
Generic steps: Templier and Paré (2018)
- Discuss the differences between review types (e.g., highlight the role of quality appraisal or grey literature)
- Remember: coherence!
Problem formulation
Discuss positioning of students’ work with regard to related review papers.
- Methodological coherence objectives/type/methods
- We have done that in the first session
Examples:
- Gap spotting: applying and testing transaction cost economics in different empirical contexts (different organizations/geographies)
- Problematization: transformational leadership theory is often glorified with a focus on the positive outcomes. A problematization approach may consider unintended outcomes (e.g., promoting groupthink or suppressing dissenting opinions within an organization)
Search
Exercise: Review a search strategy
- Hits per sub-query is helpful
- It is implicit/unclear how the search strings are connected (probably OR)
- There is no rationale to include AI Aversion but not ML aversion.
- There is no rationale to require “ML decision” to be an exact match, but Algorithm* Aversion is not required to be an exact match
- The use of quotes and wildcards is inconsistent
- For a conference paper, the authors could be required to complete the building-block matrix (or justify the design of the search strategy)
TODO : sketch a solution!!
Metrics:
- True positives (TP) = retrieved by the search and relevant
- False positives (FP) = retrieved by the search but irrelevant
- False negatives (FN) = not retrieved by the search and relevant ❓
- True negatives (TN) = not retrieved by the search but irrelevant ❓
- It is instructive to know these metrics
- The key objective is to identify all relevant papers, but also to do that efficiently
- A certain level of noise (precision) must be accepted
SYNERGY datasets: https://github.com/asreview/synergy-dataset
- included = relevant
- all records (retrieved) = True positives and False positives
-
on average: 4% or 2% when removing outliers
- check absolute numbers: covering 1,000 papers to identify 20-40 relevant ones (search may be too narrow when the inclusion percentage is bigger)
Outlook: “We have waited too often that database provides improve search capabilities”!
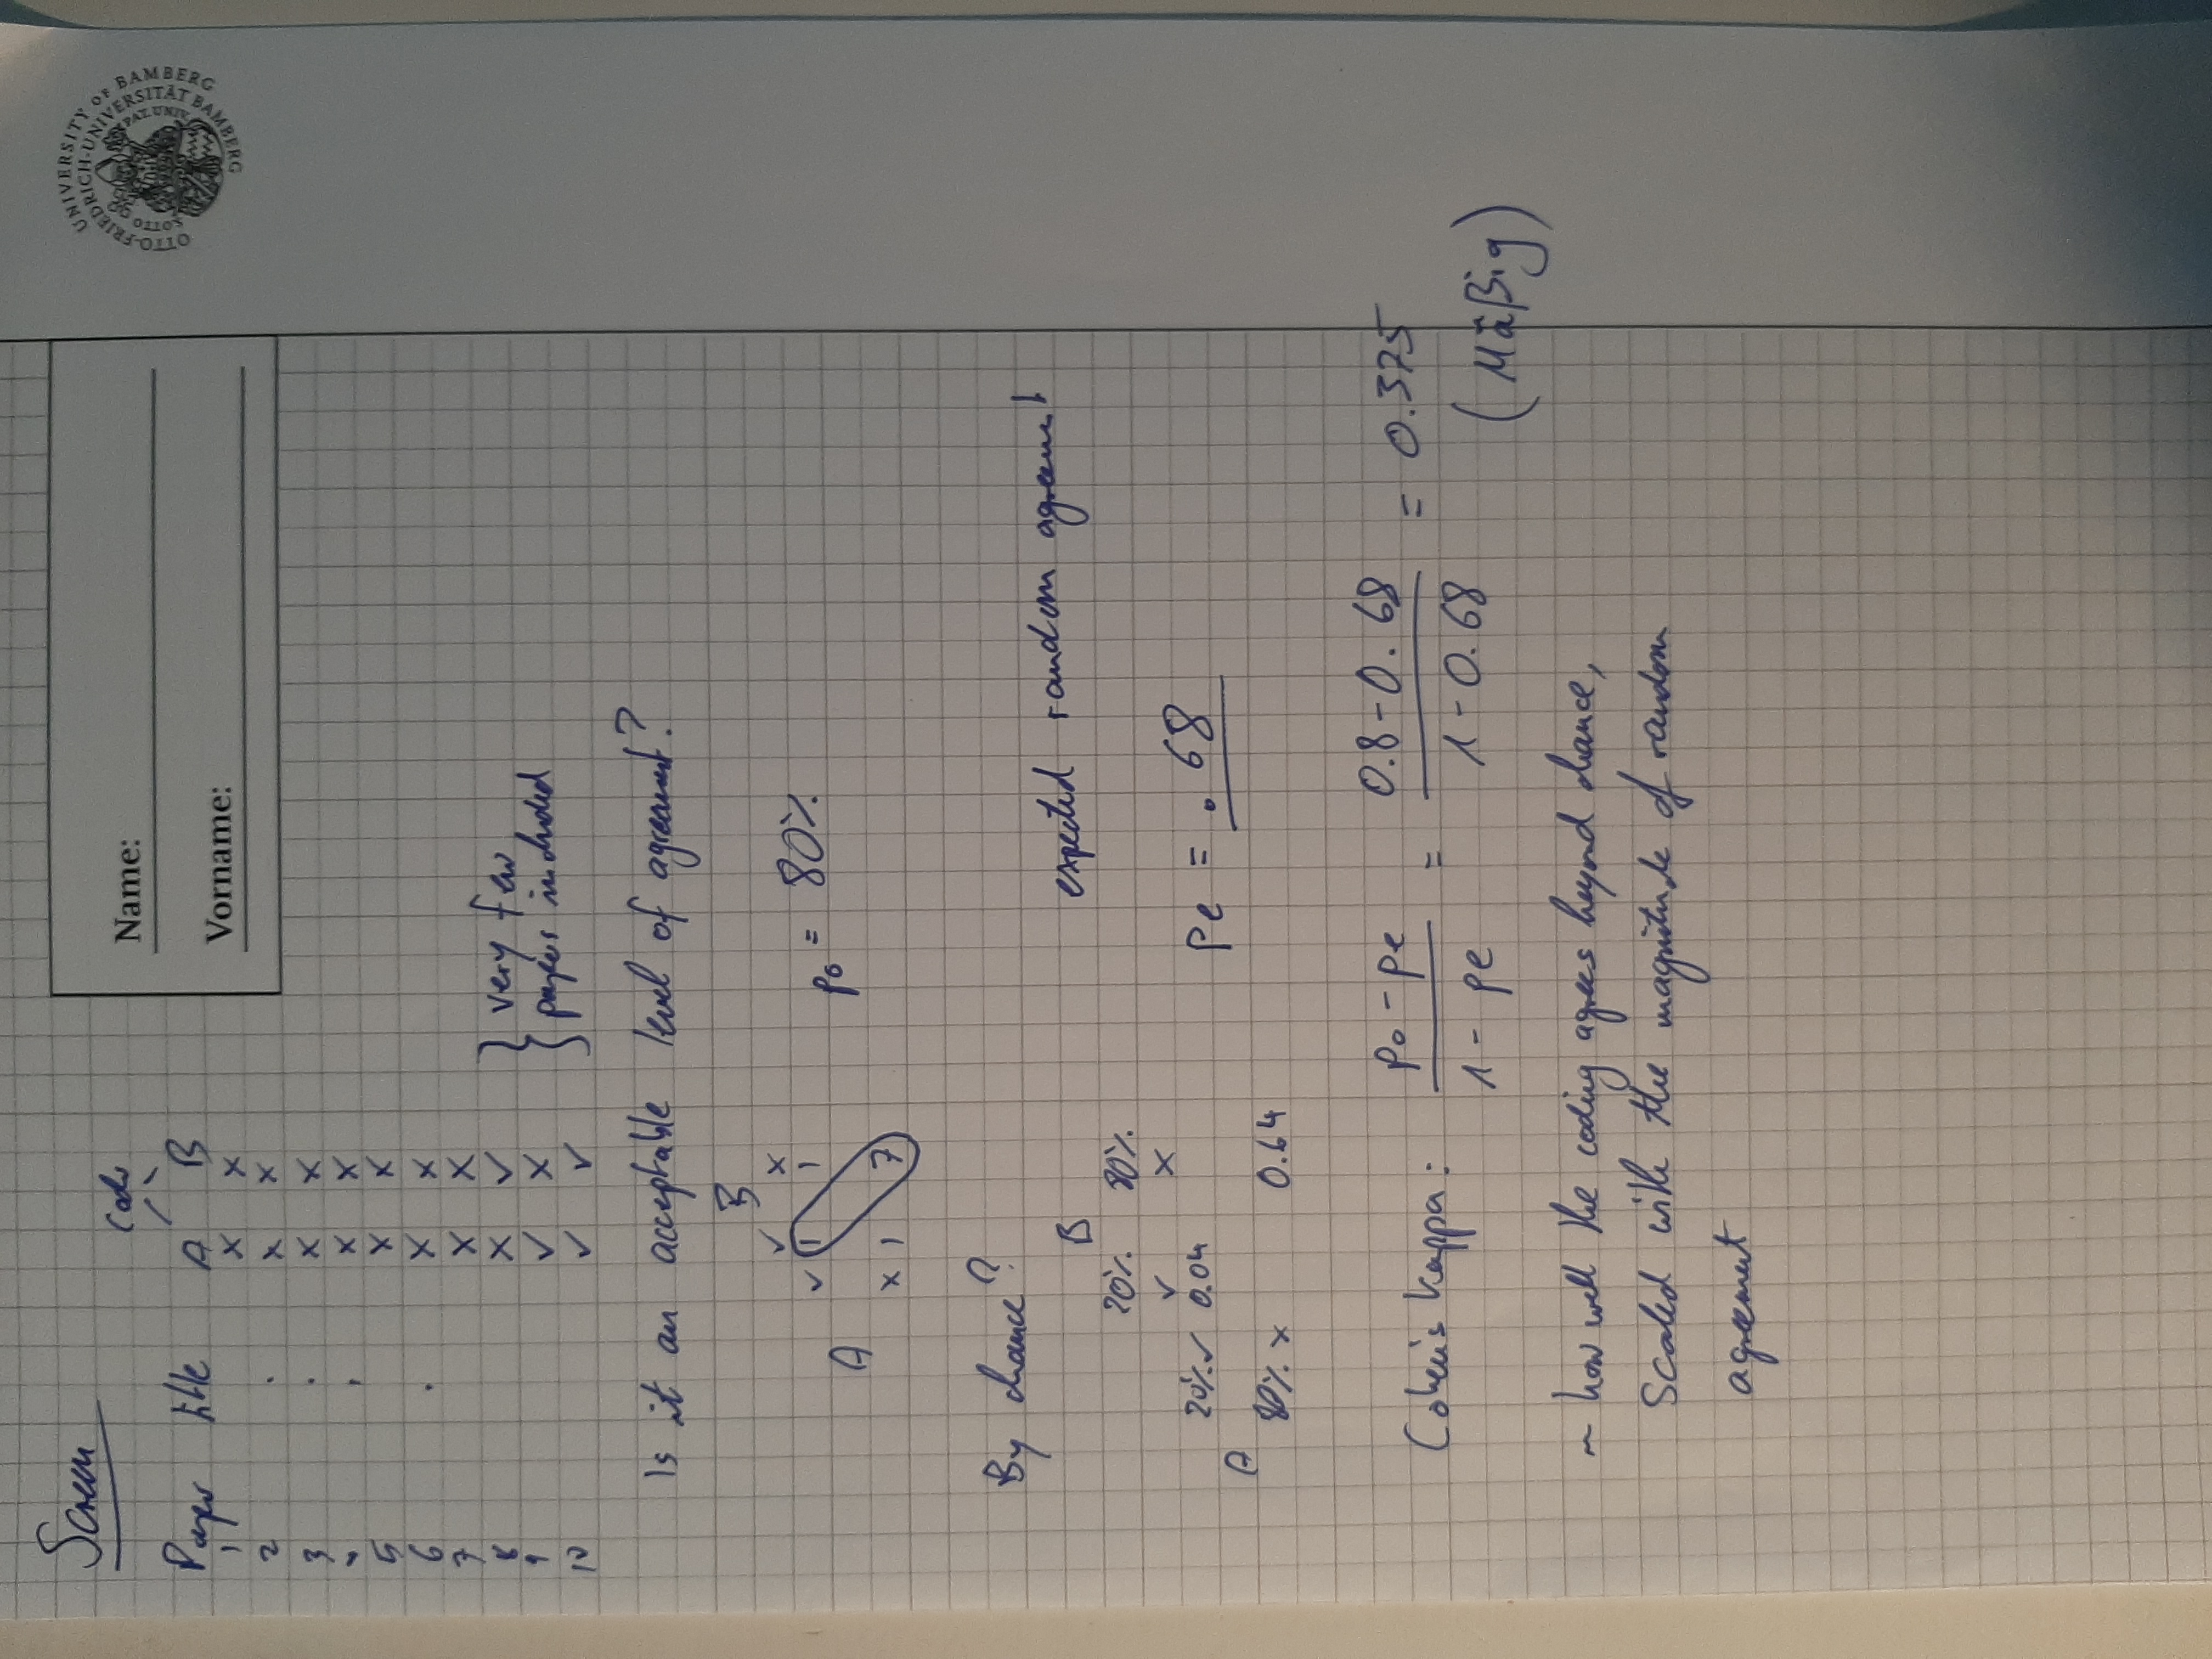
Screening (reliability)
Illustrate “Percentage agreement, Agreement by chance” with an example on the blackboard
Inductive
Exercise
Worksheet is linked on the slides. Have students analyze, code in groups
Q: What are the key processes across extracted documents?
Key challenges:
- Terminology
- Scope
- Abstraction
- Differences in focus/perspective
Data extraction
VOS-Viewer:
- TBD: Illustrate differences between co-citation analysis and bibliographic coupling?
- Highlight the Web of Science data export format
Vote counting: Example: Lacity et al. (2011)
TODO : summarize vote counting and give an outlook on meta-analyses
- data extraction (reliability, …)
- risk-of-bias (quality) assessment
- Vote counting example (meta-analysis)
Aggregating evidence: Hierarchy of evidence (medicine)
Exercise
Coding: Meta-analysis
Explain RCTs (based on CONSORT): eligibility, randomization, intervention, follow-up, analysis
Show the coding sheet: Thorndike (annotations)
- Van Blarigan:
- intervention: booklet + Fitbit + texts
- control: more active at baseline! (differences in baseline should be randomly distributed across studies, they should be smaller for larger samples)
- For “training”: show RCT schema:
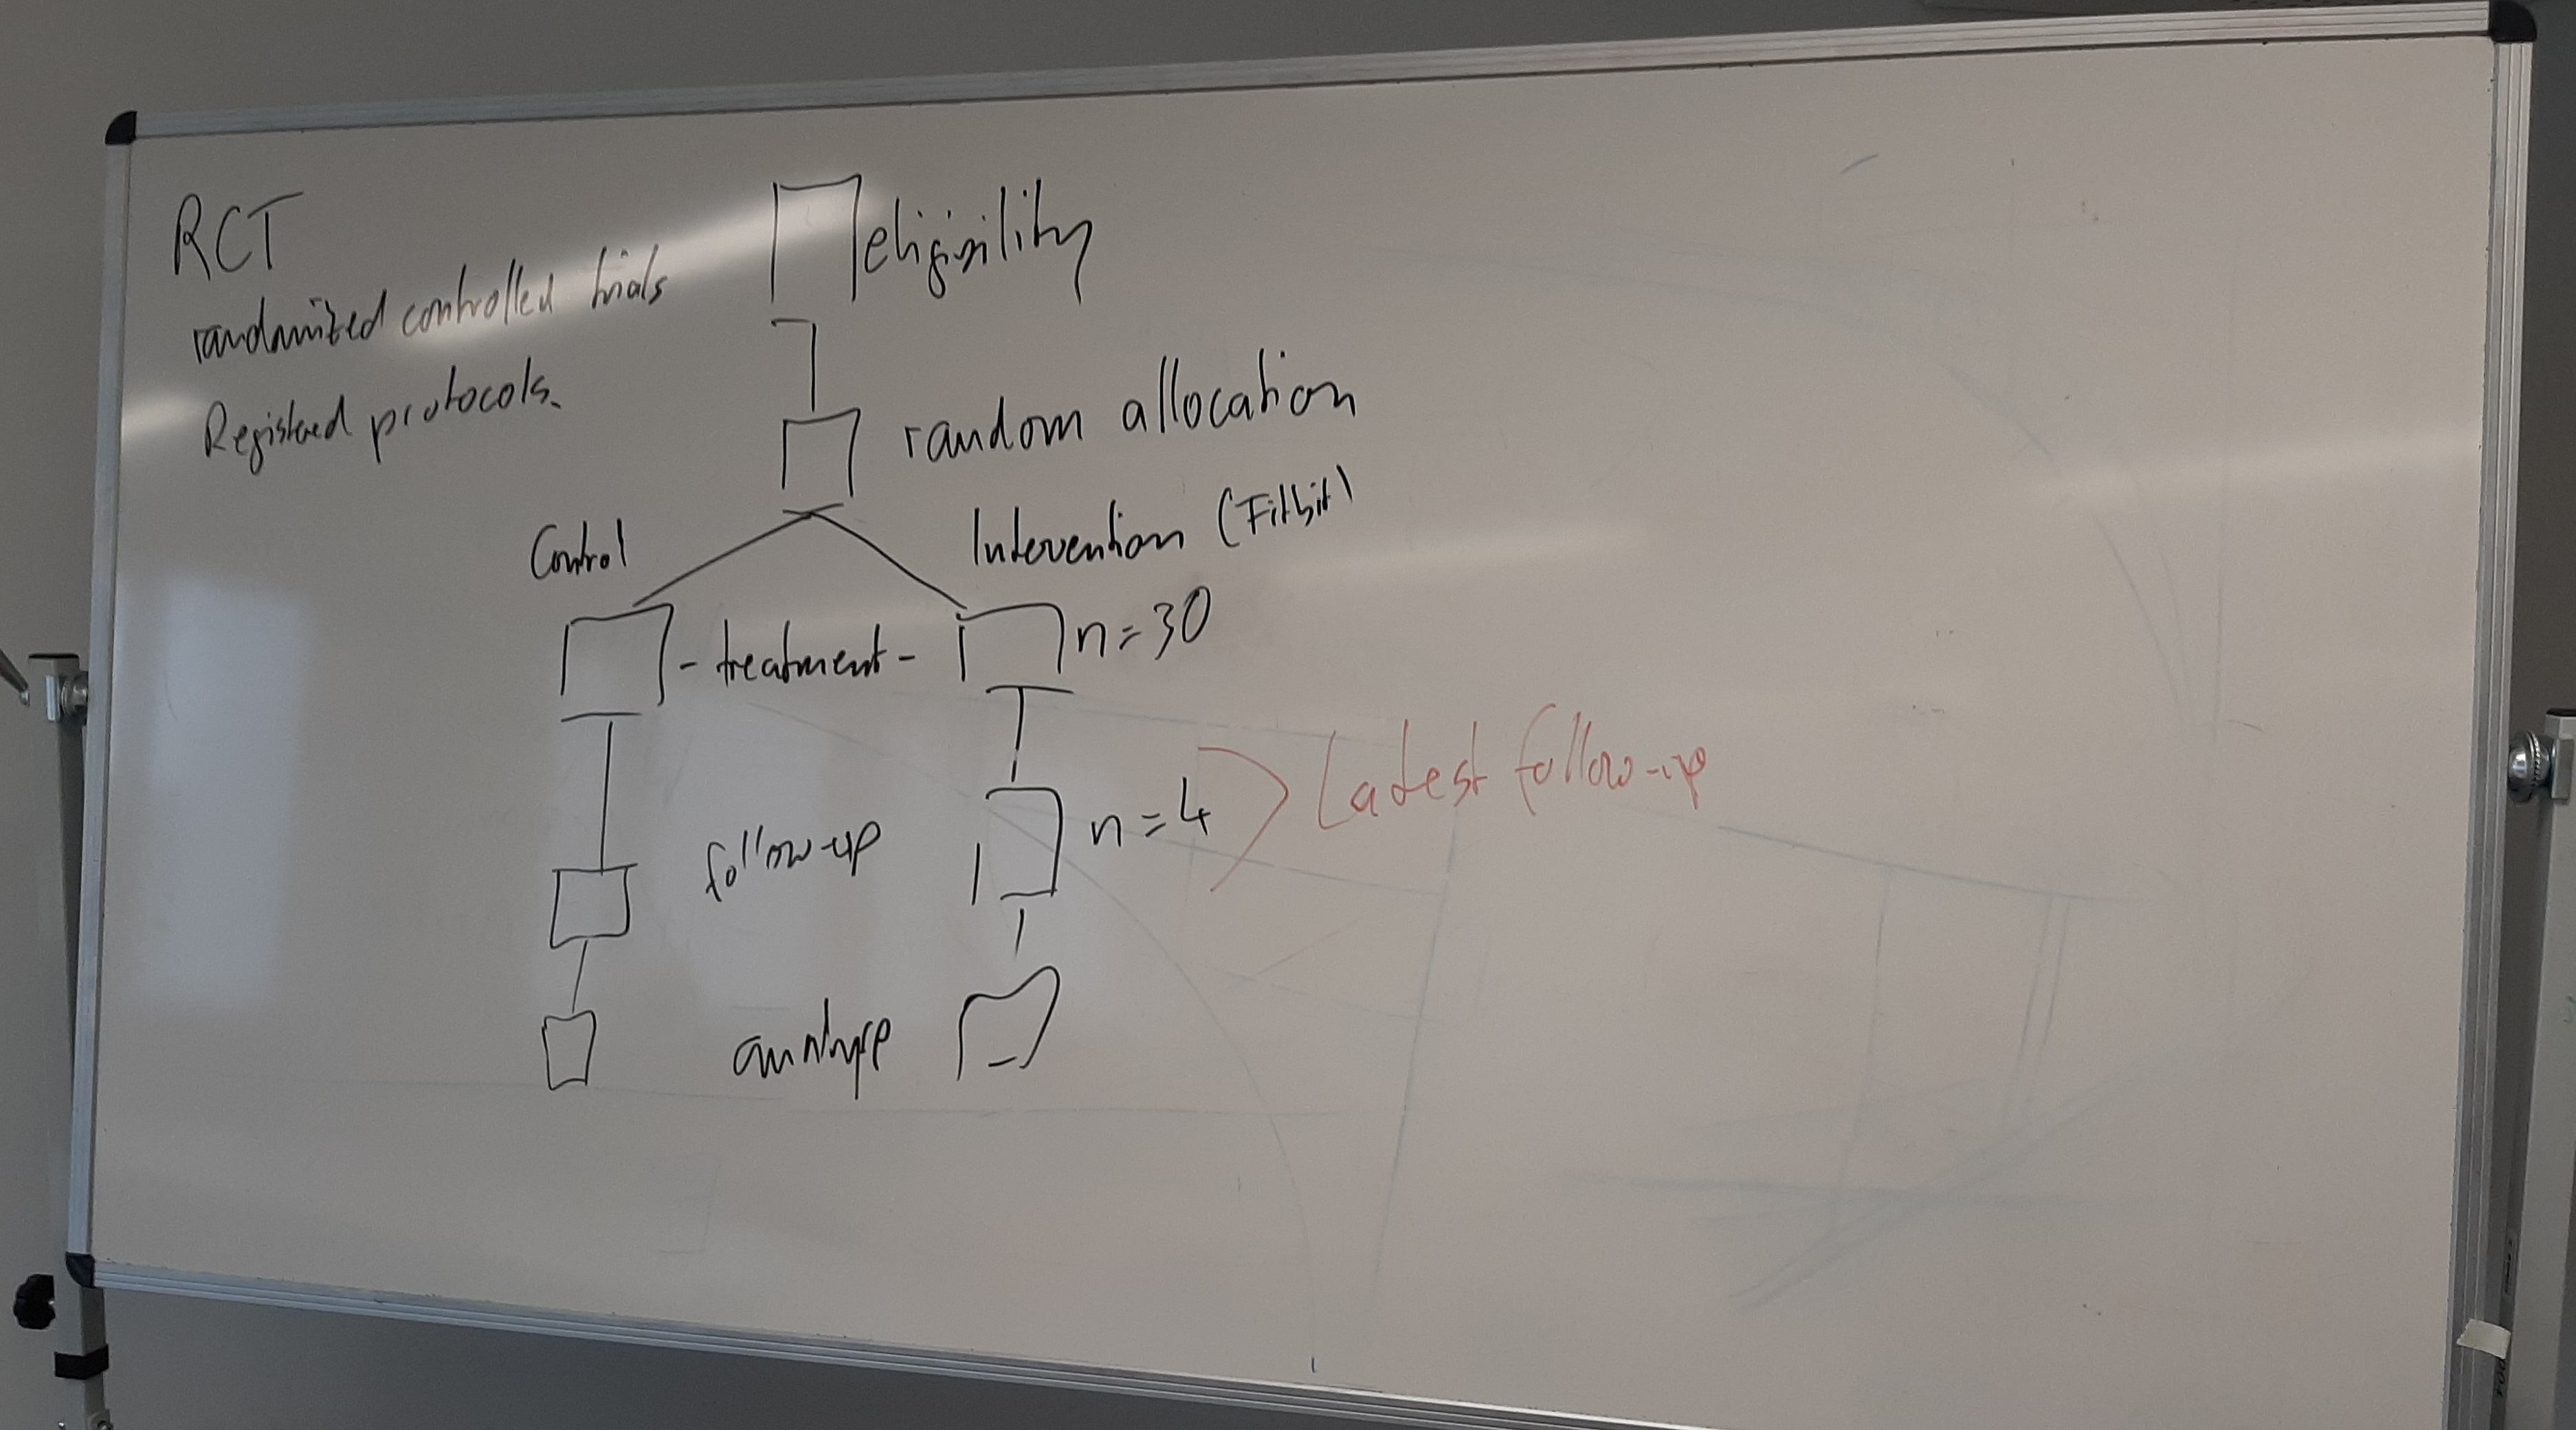
- Highlight the need to have a clear plan (e.g., which follow-up will be considered?)
Solution (LRTracker - data extraction fig 4)
Feedback Ask students to note down: one thing that was good (would like to keep), one that was not so good (would like to leave).